Your All-in-One Solution
FAST, EFFICIENT, FREE OF CHARGE, BASED ON IBCS®
TEMPLATES
Based on IBCS® Standards
See the difference
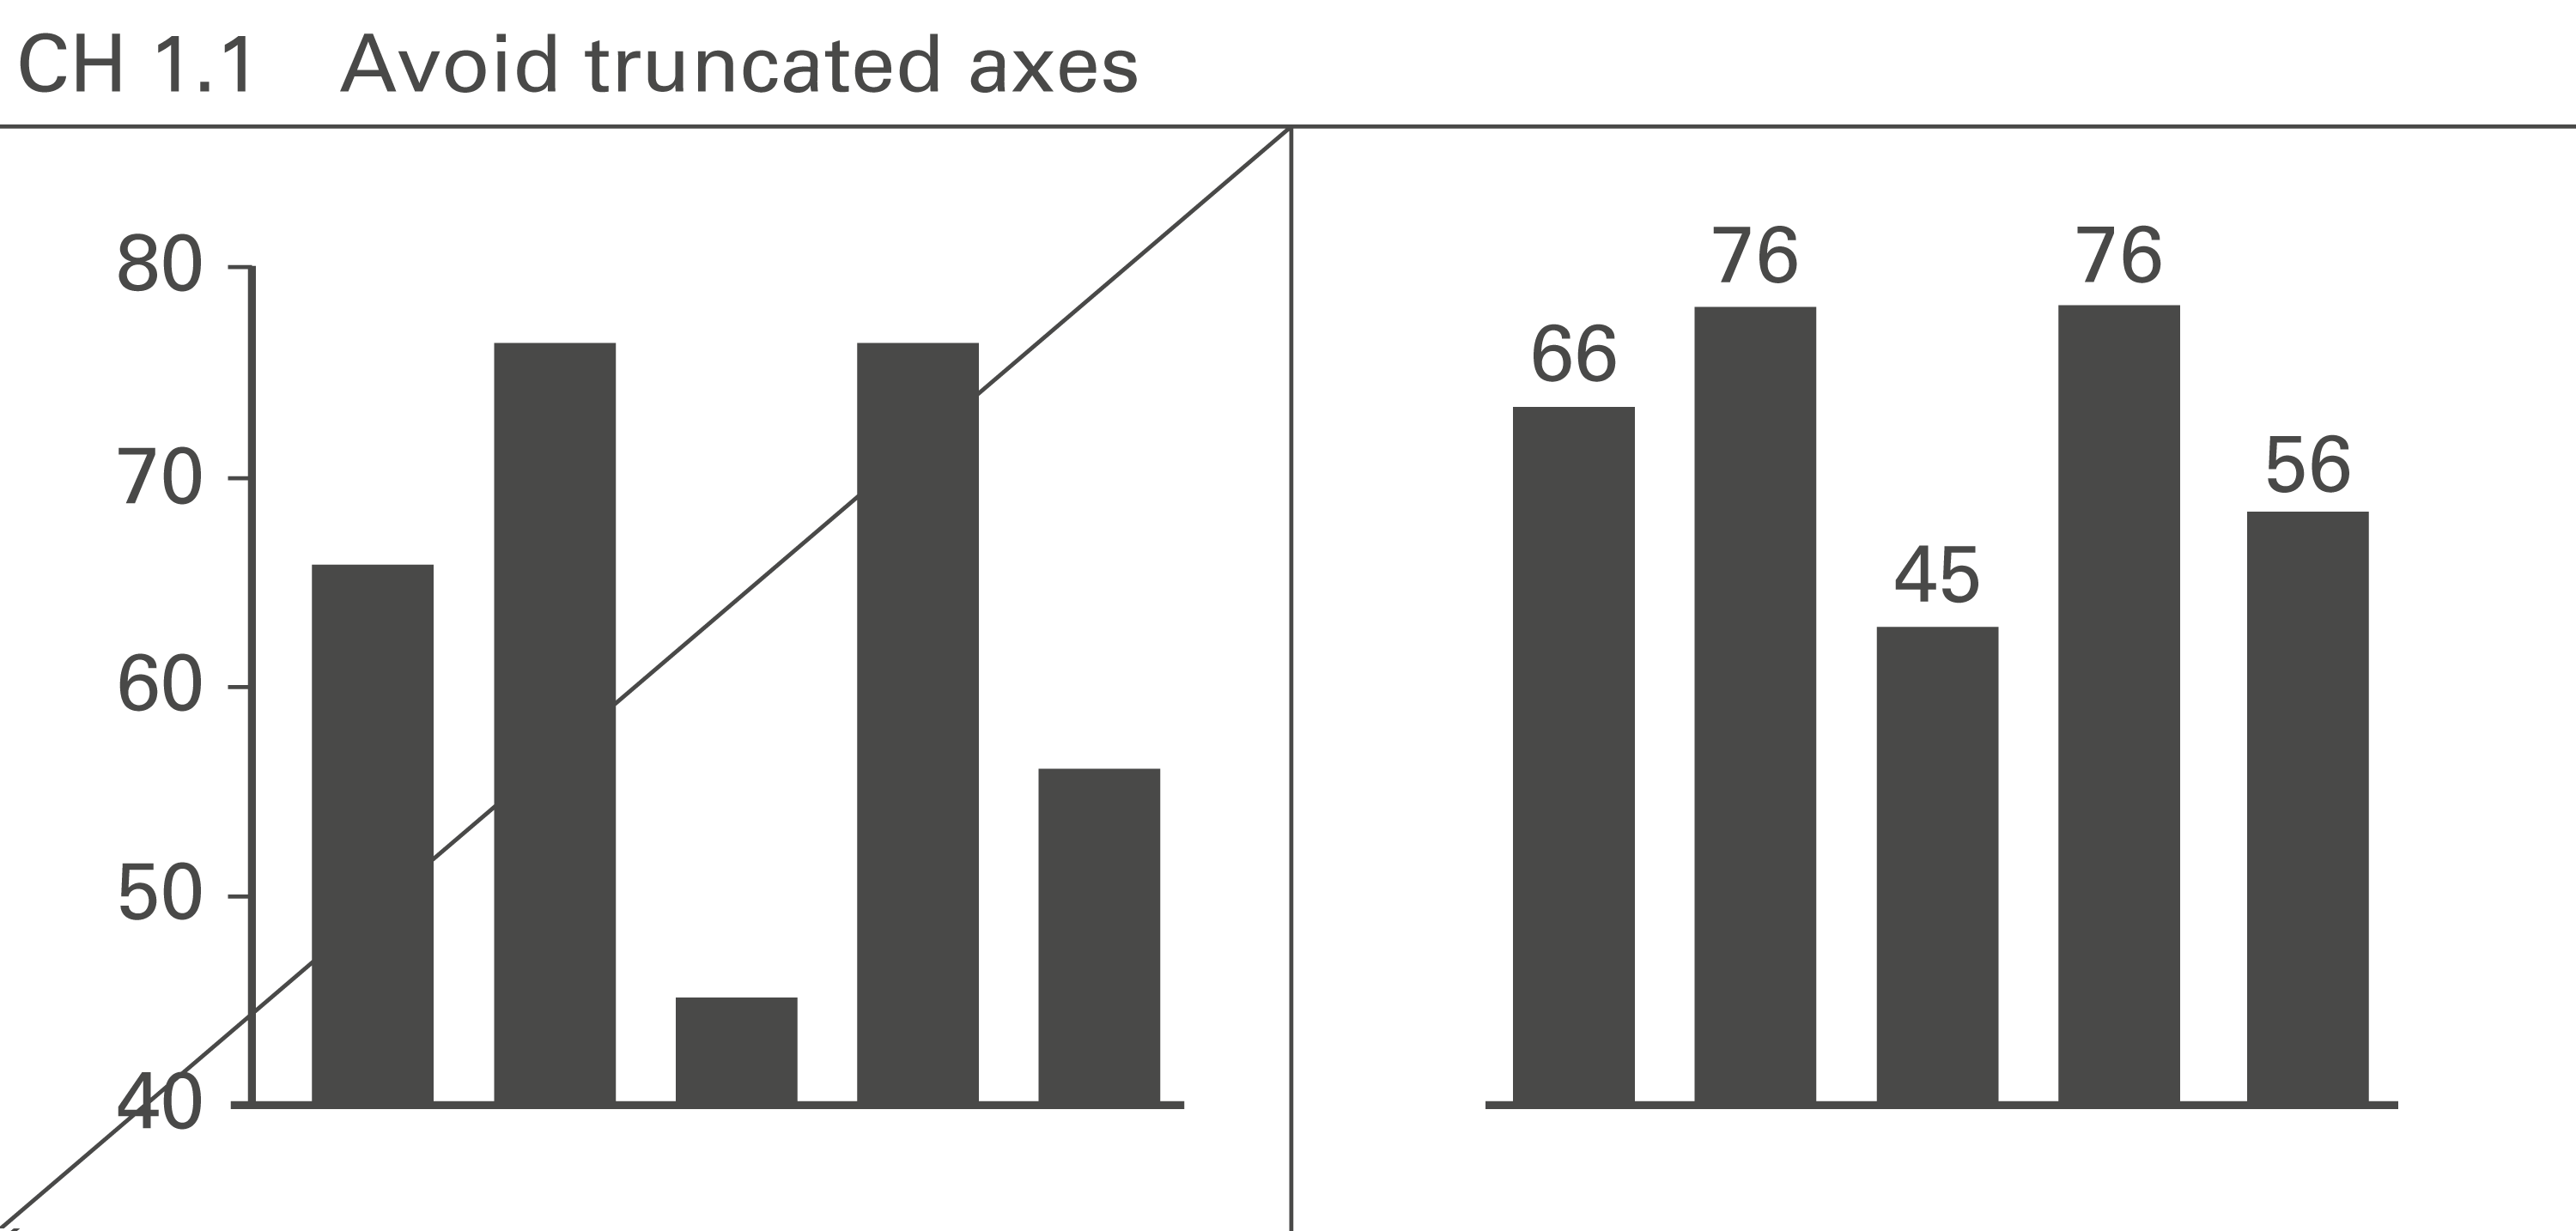
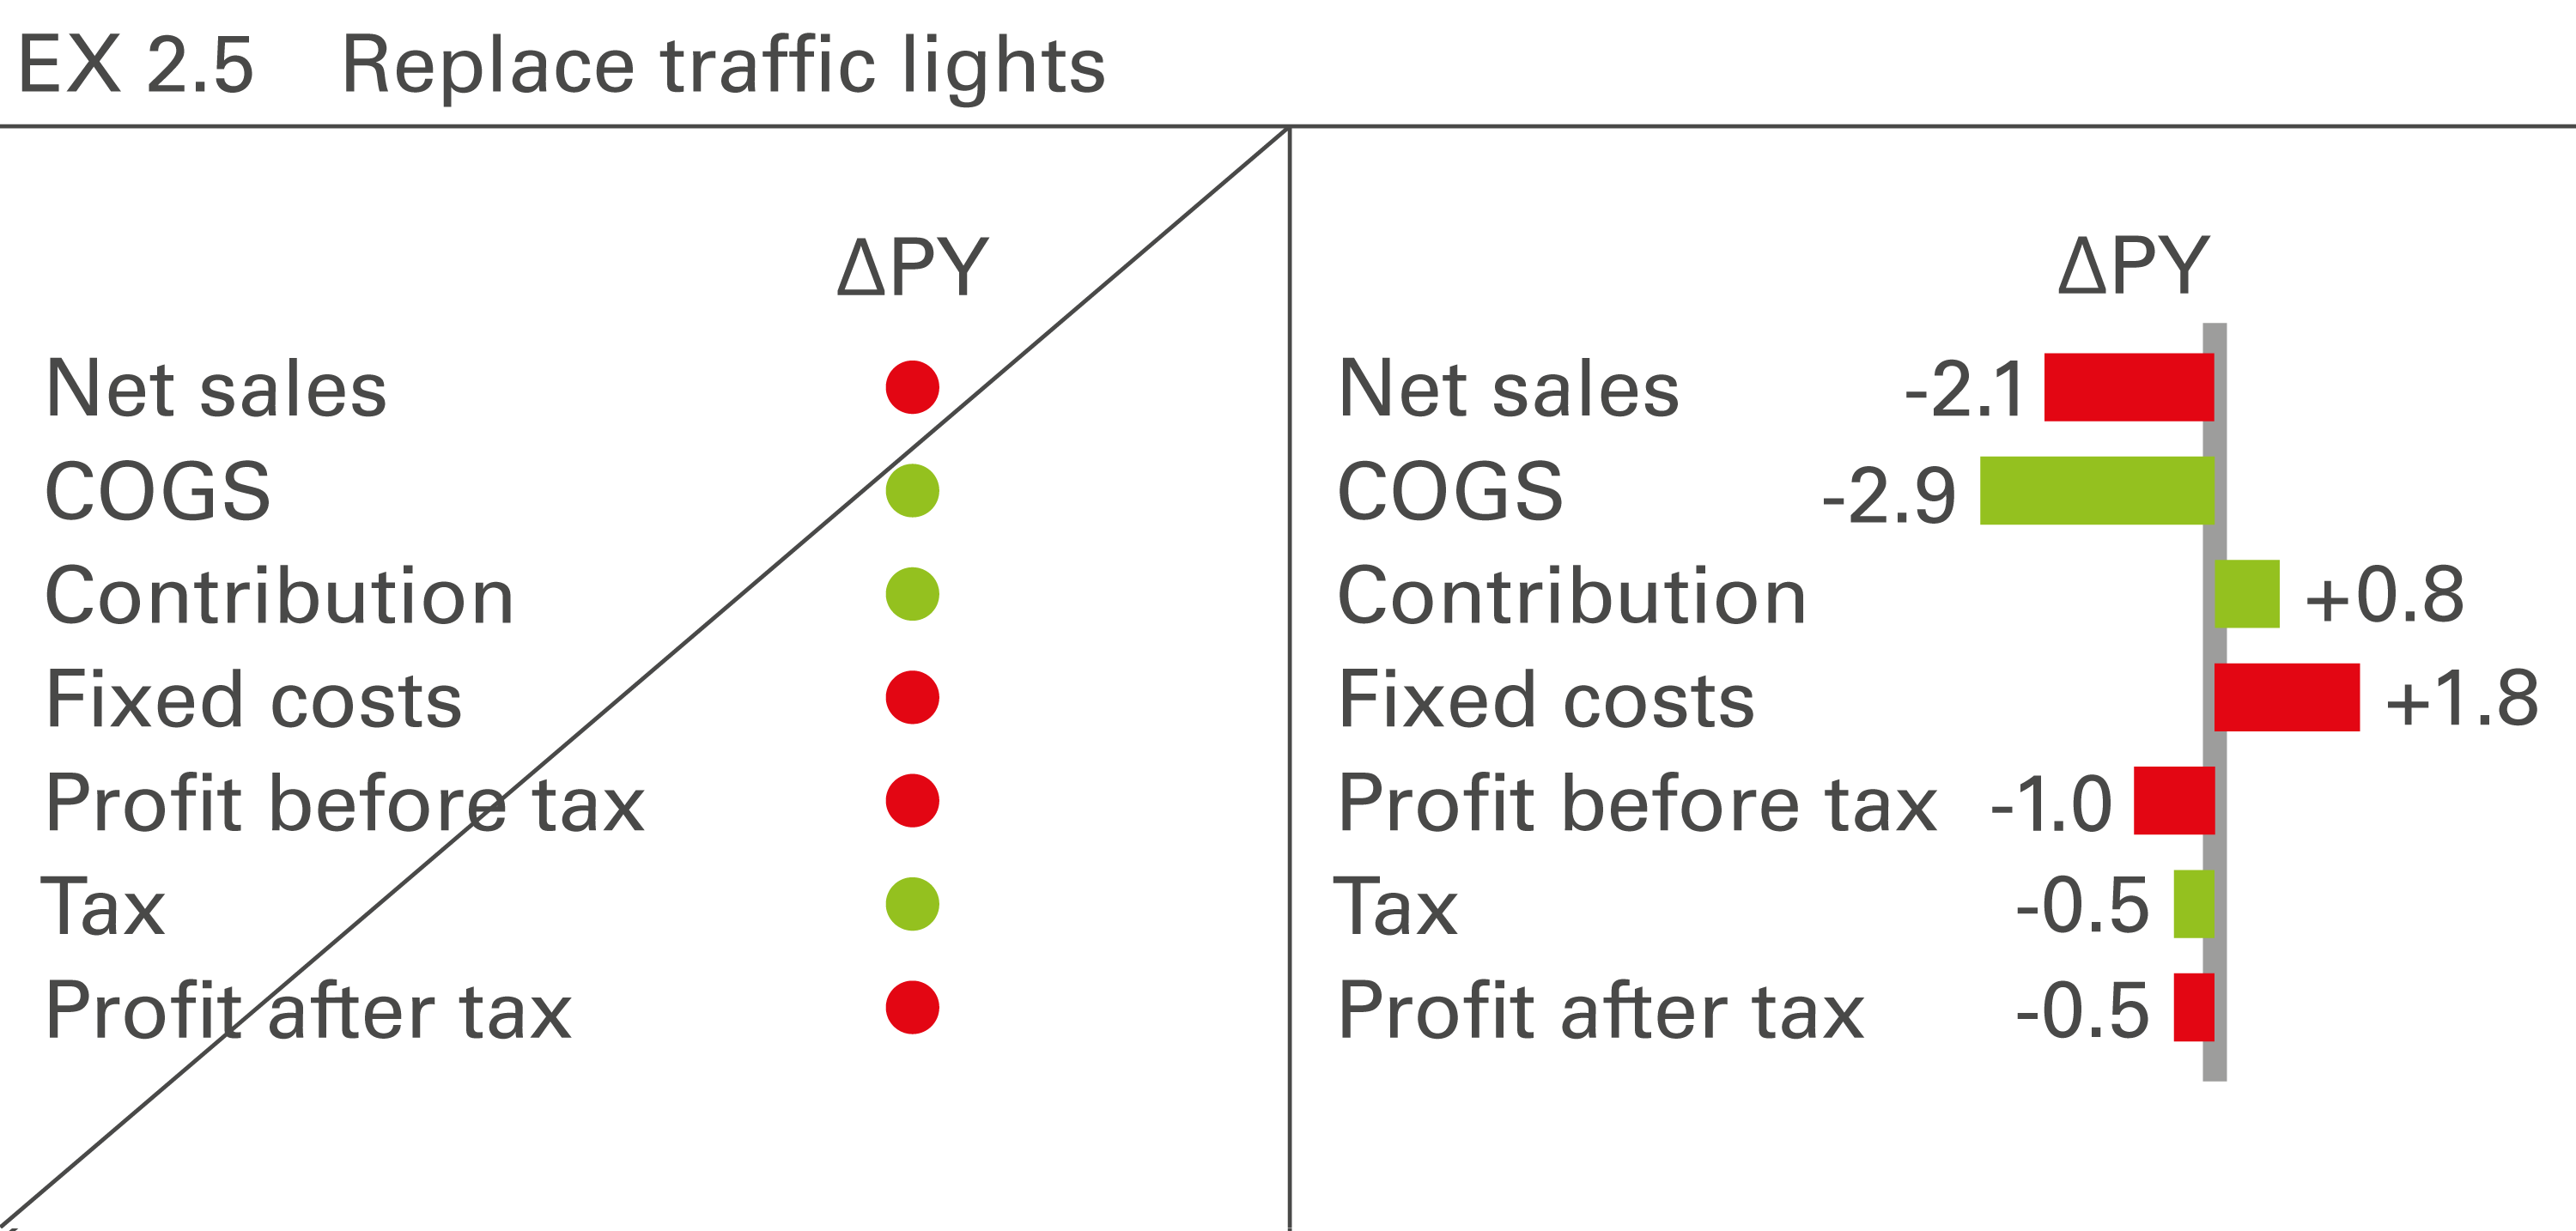
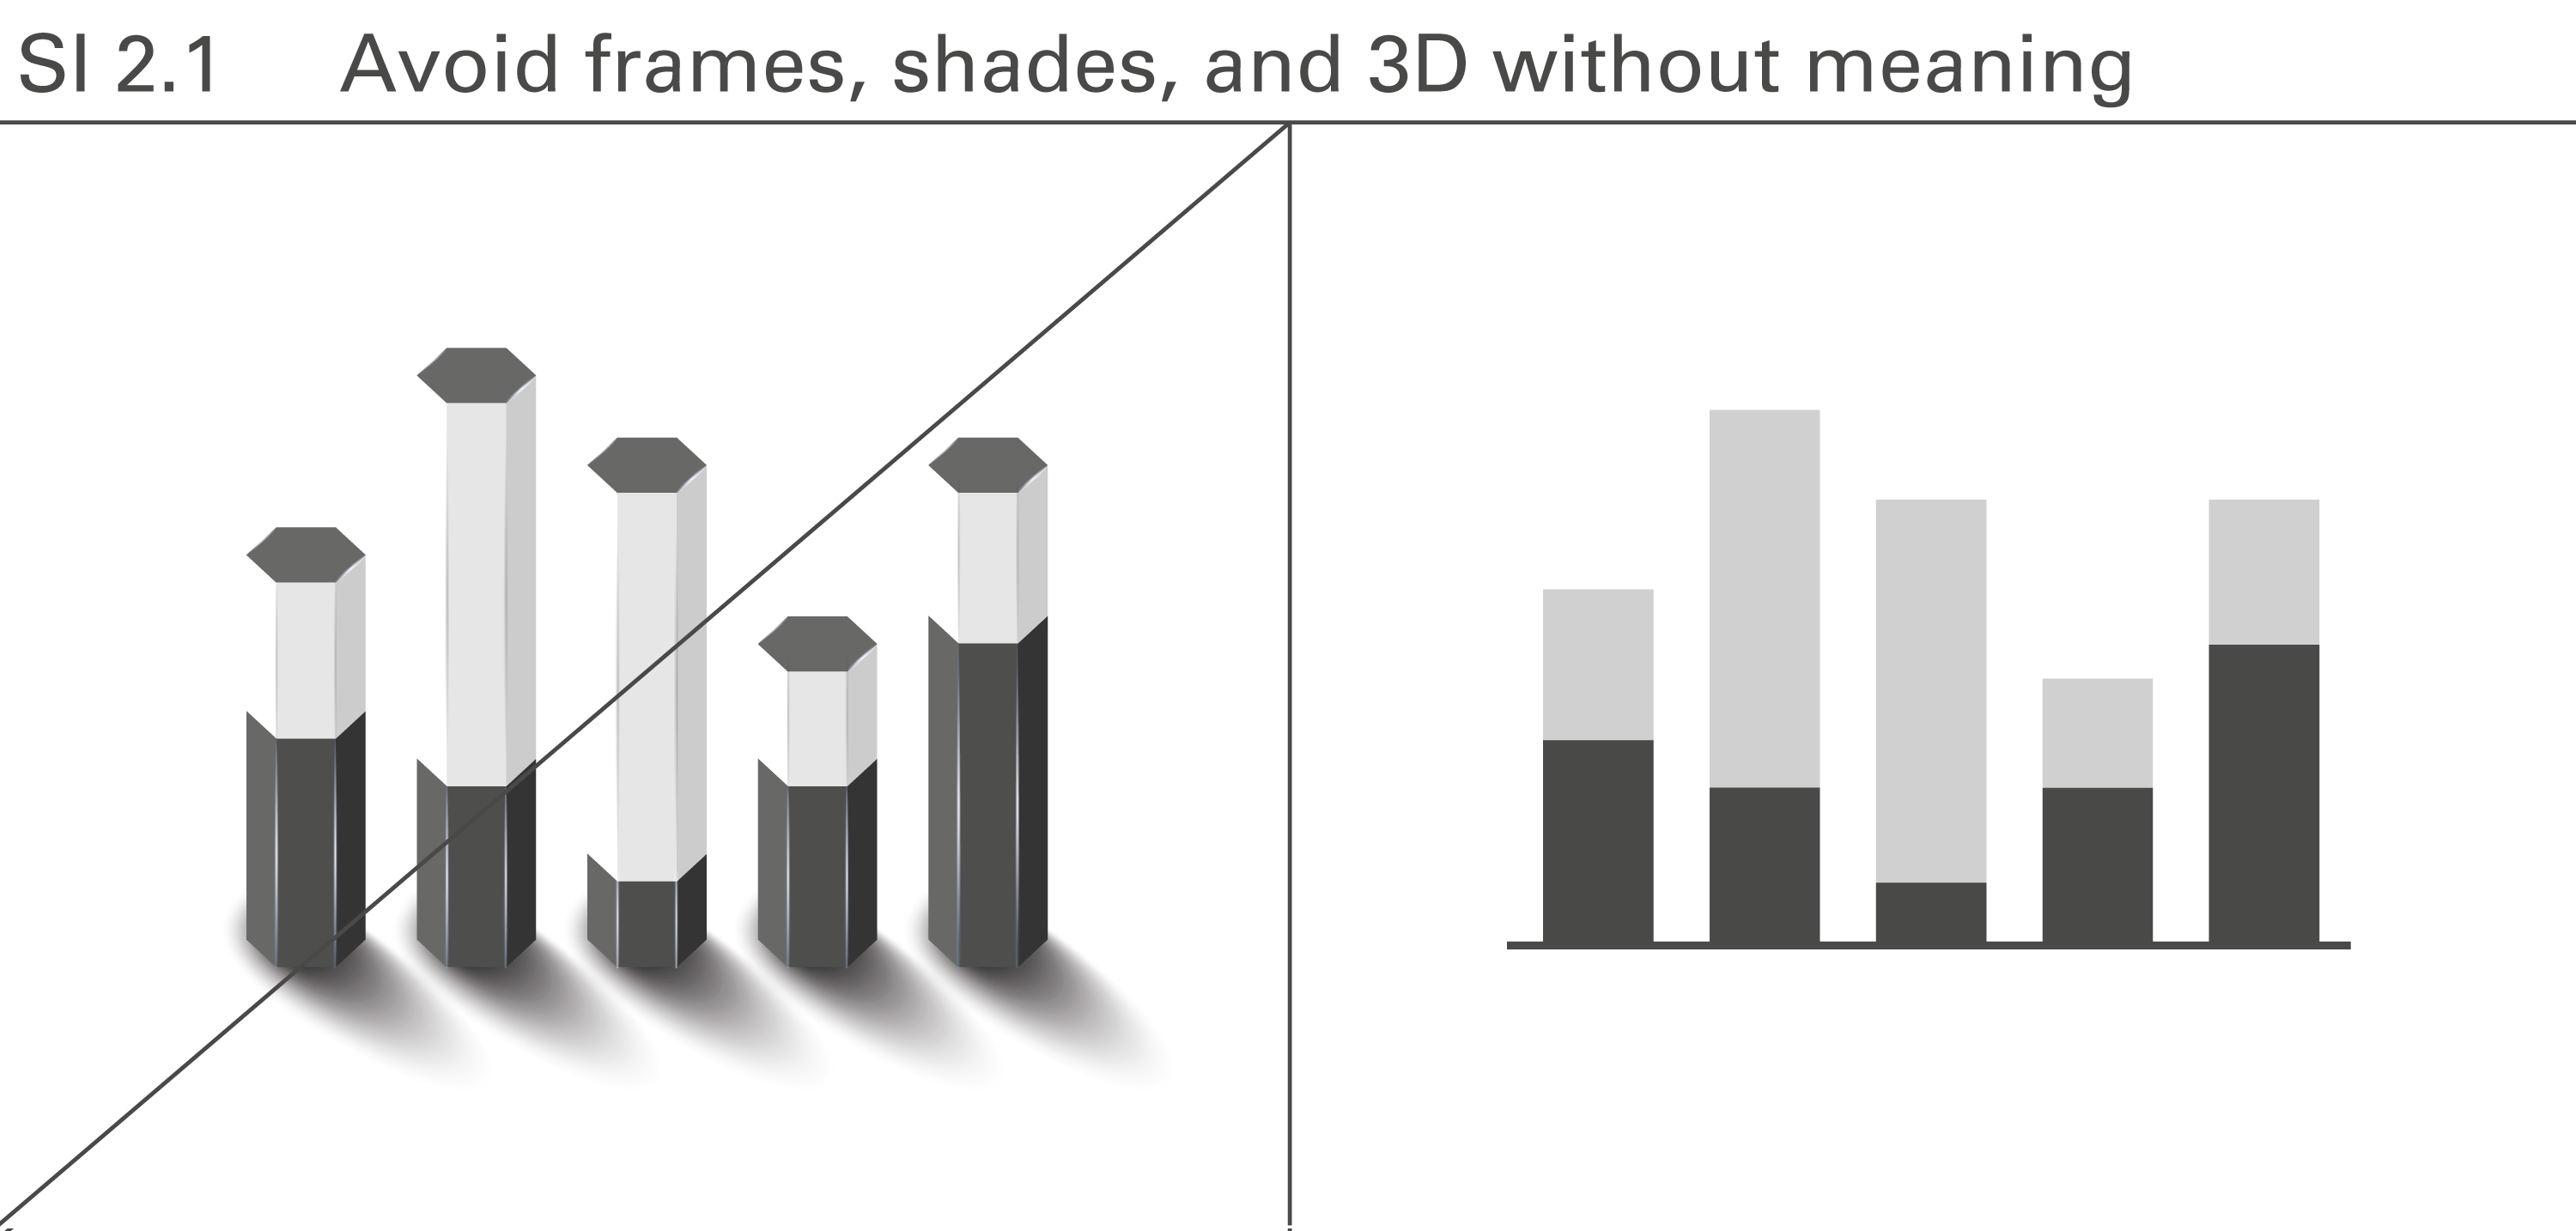
From cluttered to clear
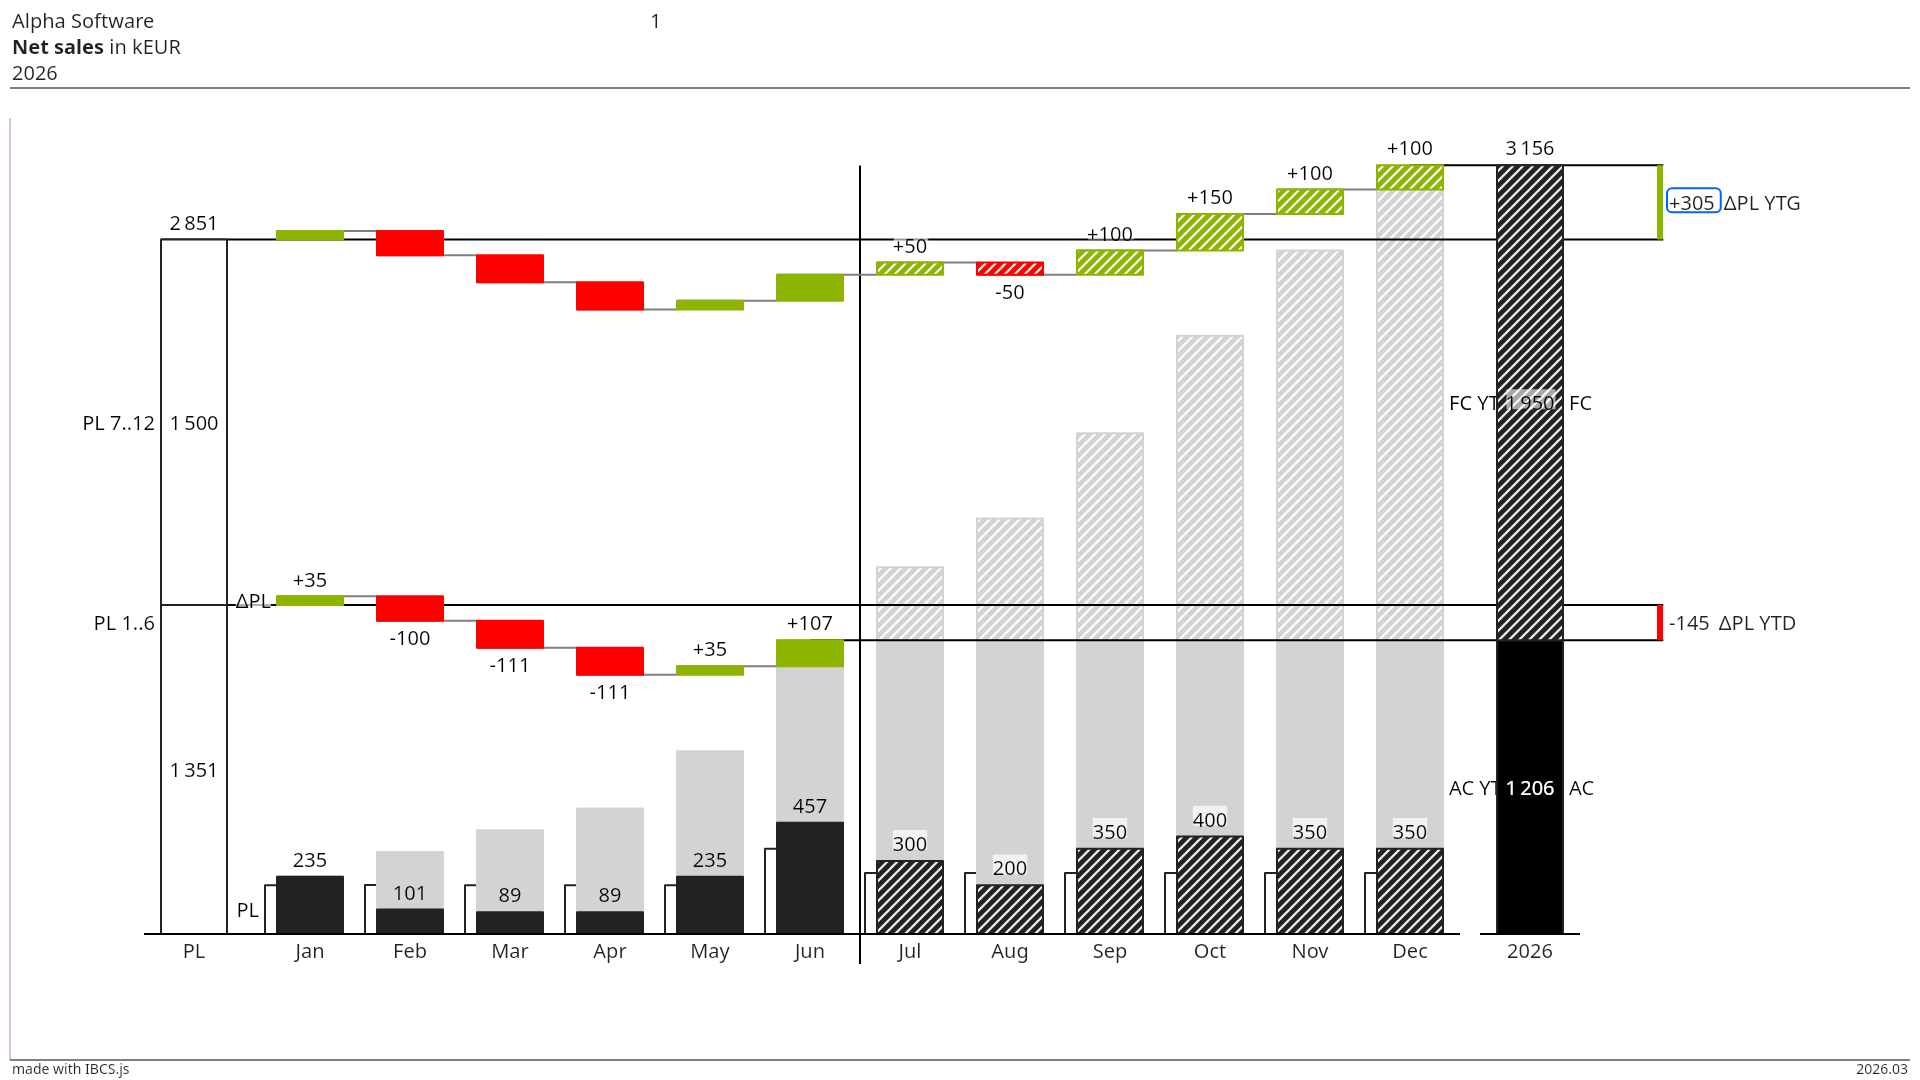
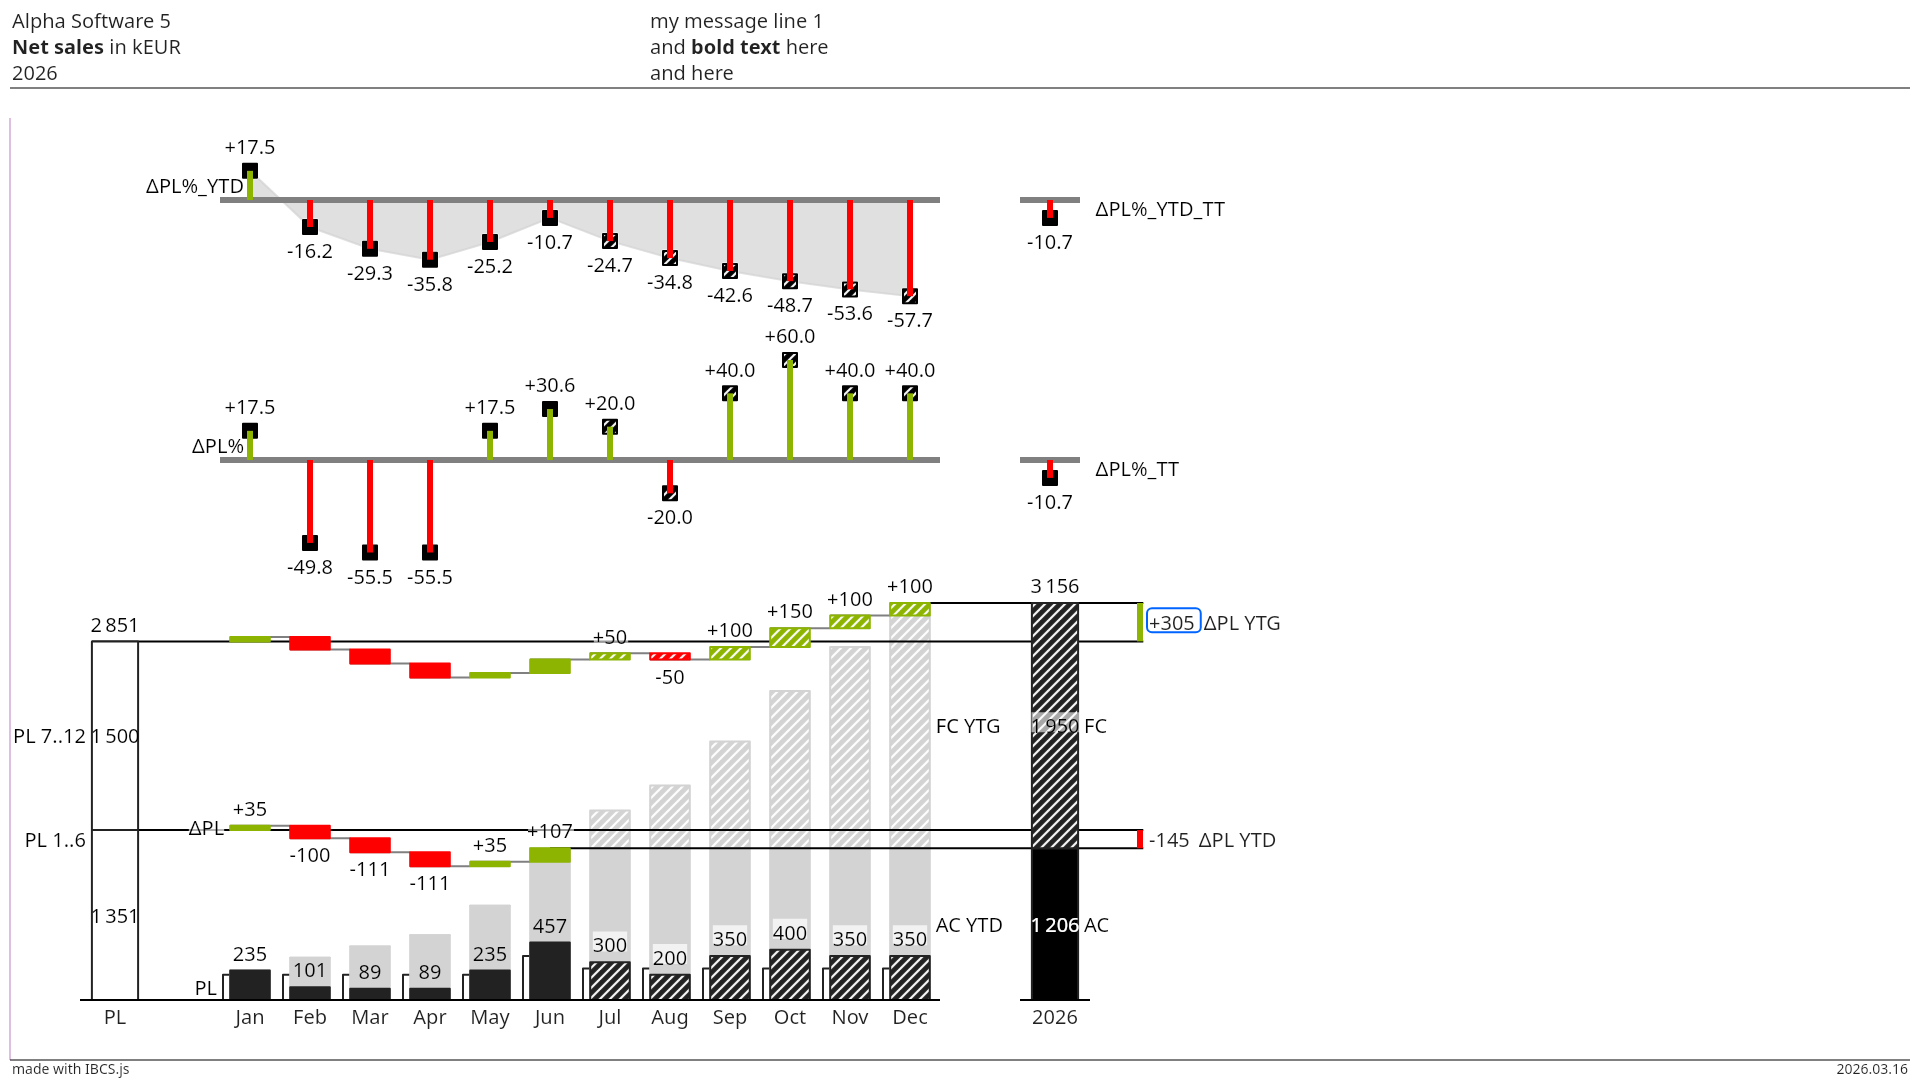
The same numbers, told two ways. Drag the handle to compare a conventional chart with the same data presented the UNIFORMCHART way.

 Conventional UniformChart
 How it works
From template to export
Pick a template
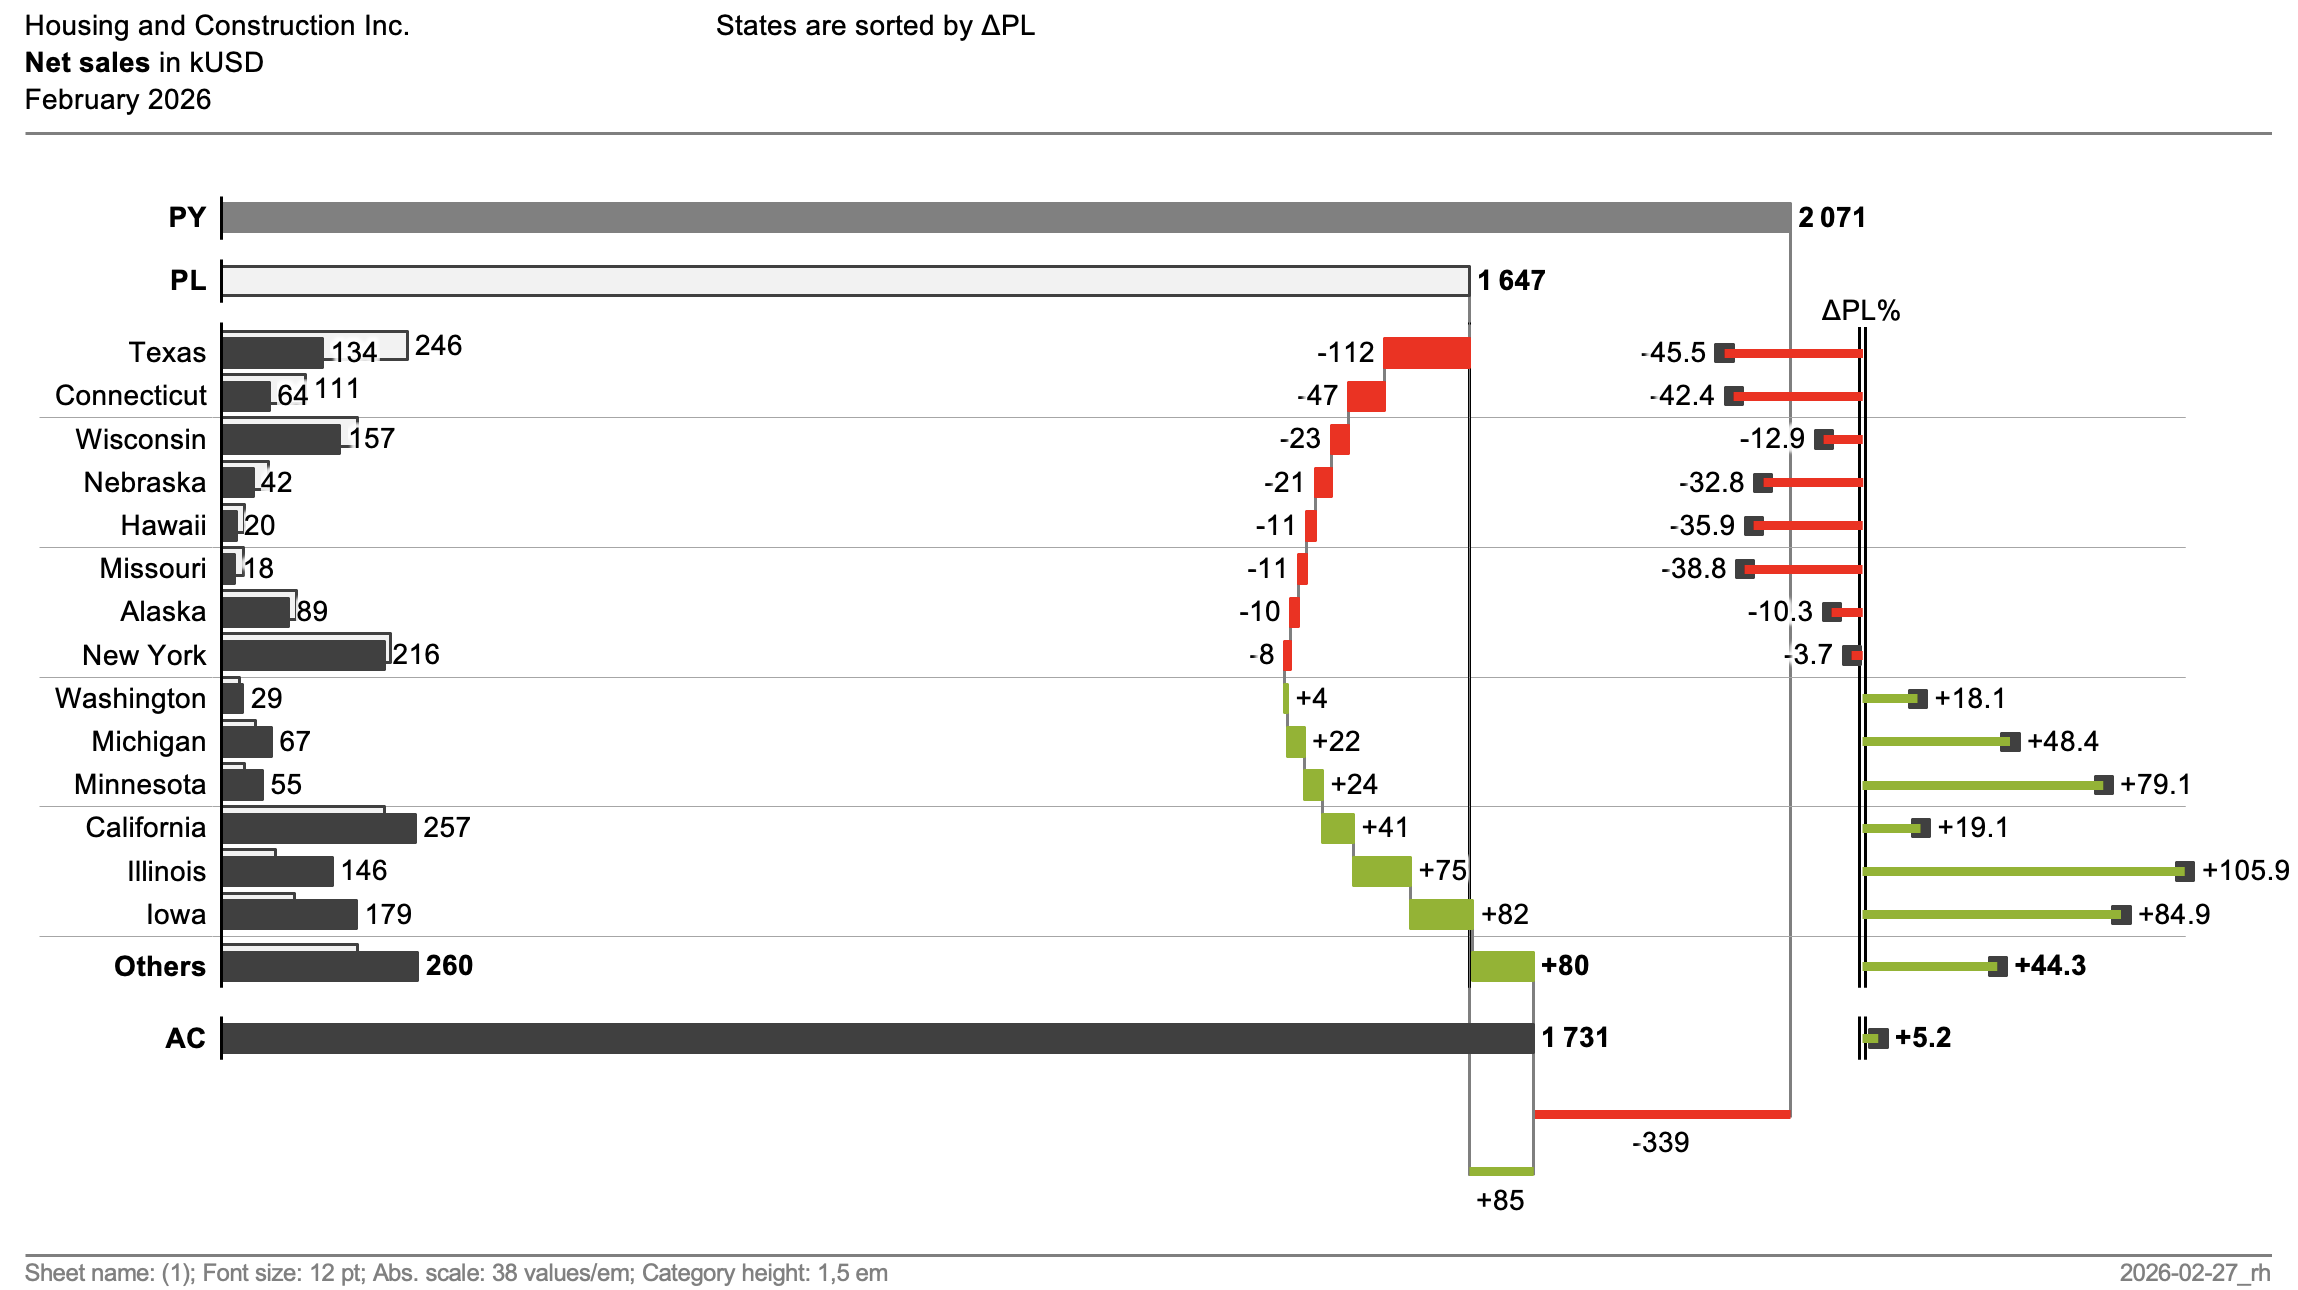
Start from a curated, IBCS-standard chart — variance waterfalls, column charts and tables. Browse them all without an account.
- No setup, no learning curve
- Built on IBCS / ISO 24896 notation
- New templates added regularly
Edit your data
Adjust the numbers the way that suits you — type into the table directly, or describe the change in the built-in chat: “set Q4 to 1,640”, “rename to Net revenue”.
- Edit values right in the table
- Or change them with the built-in chat
- Add or remove data points
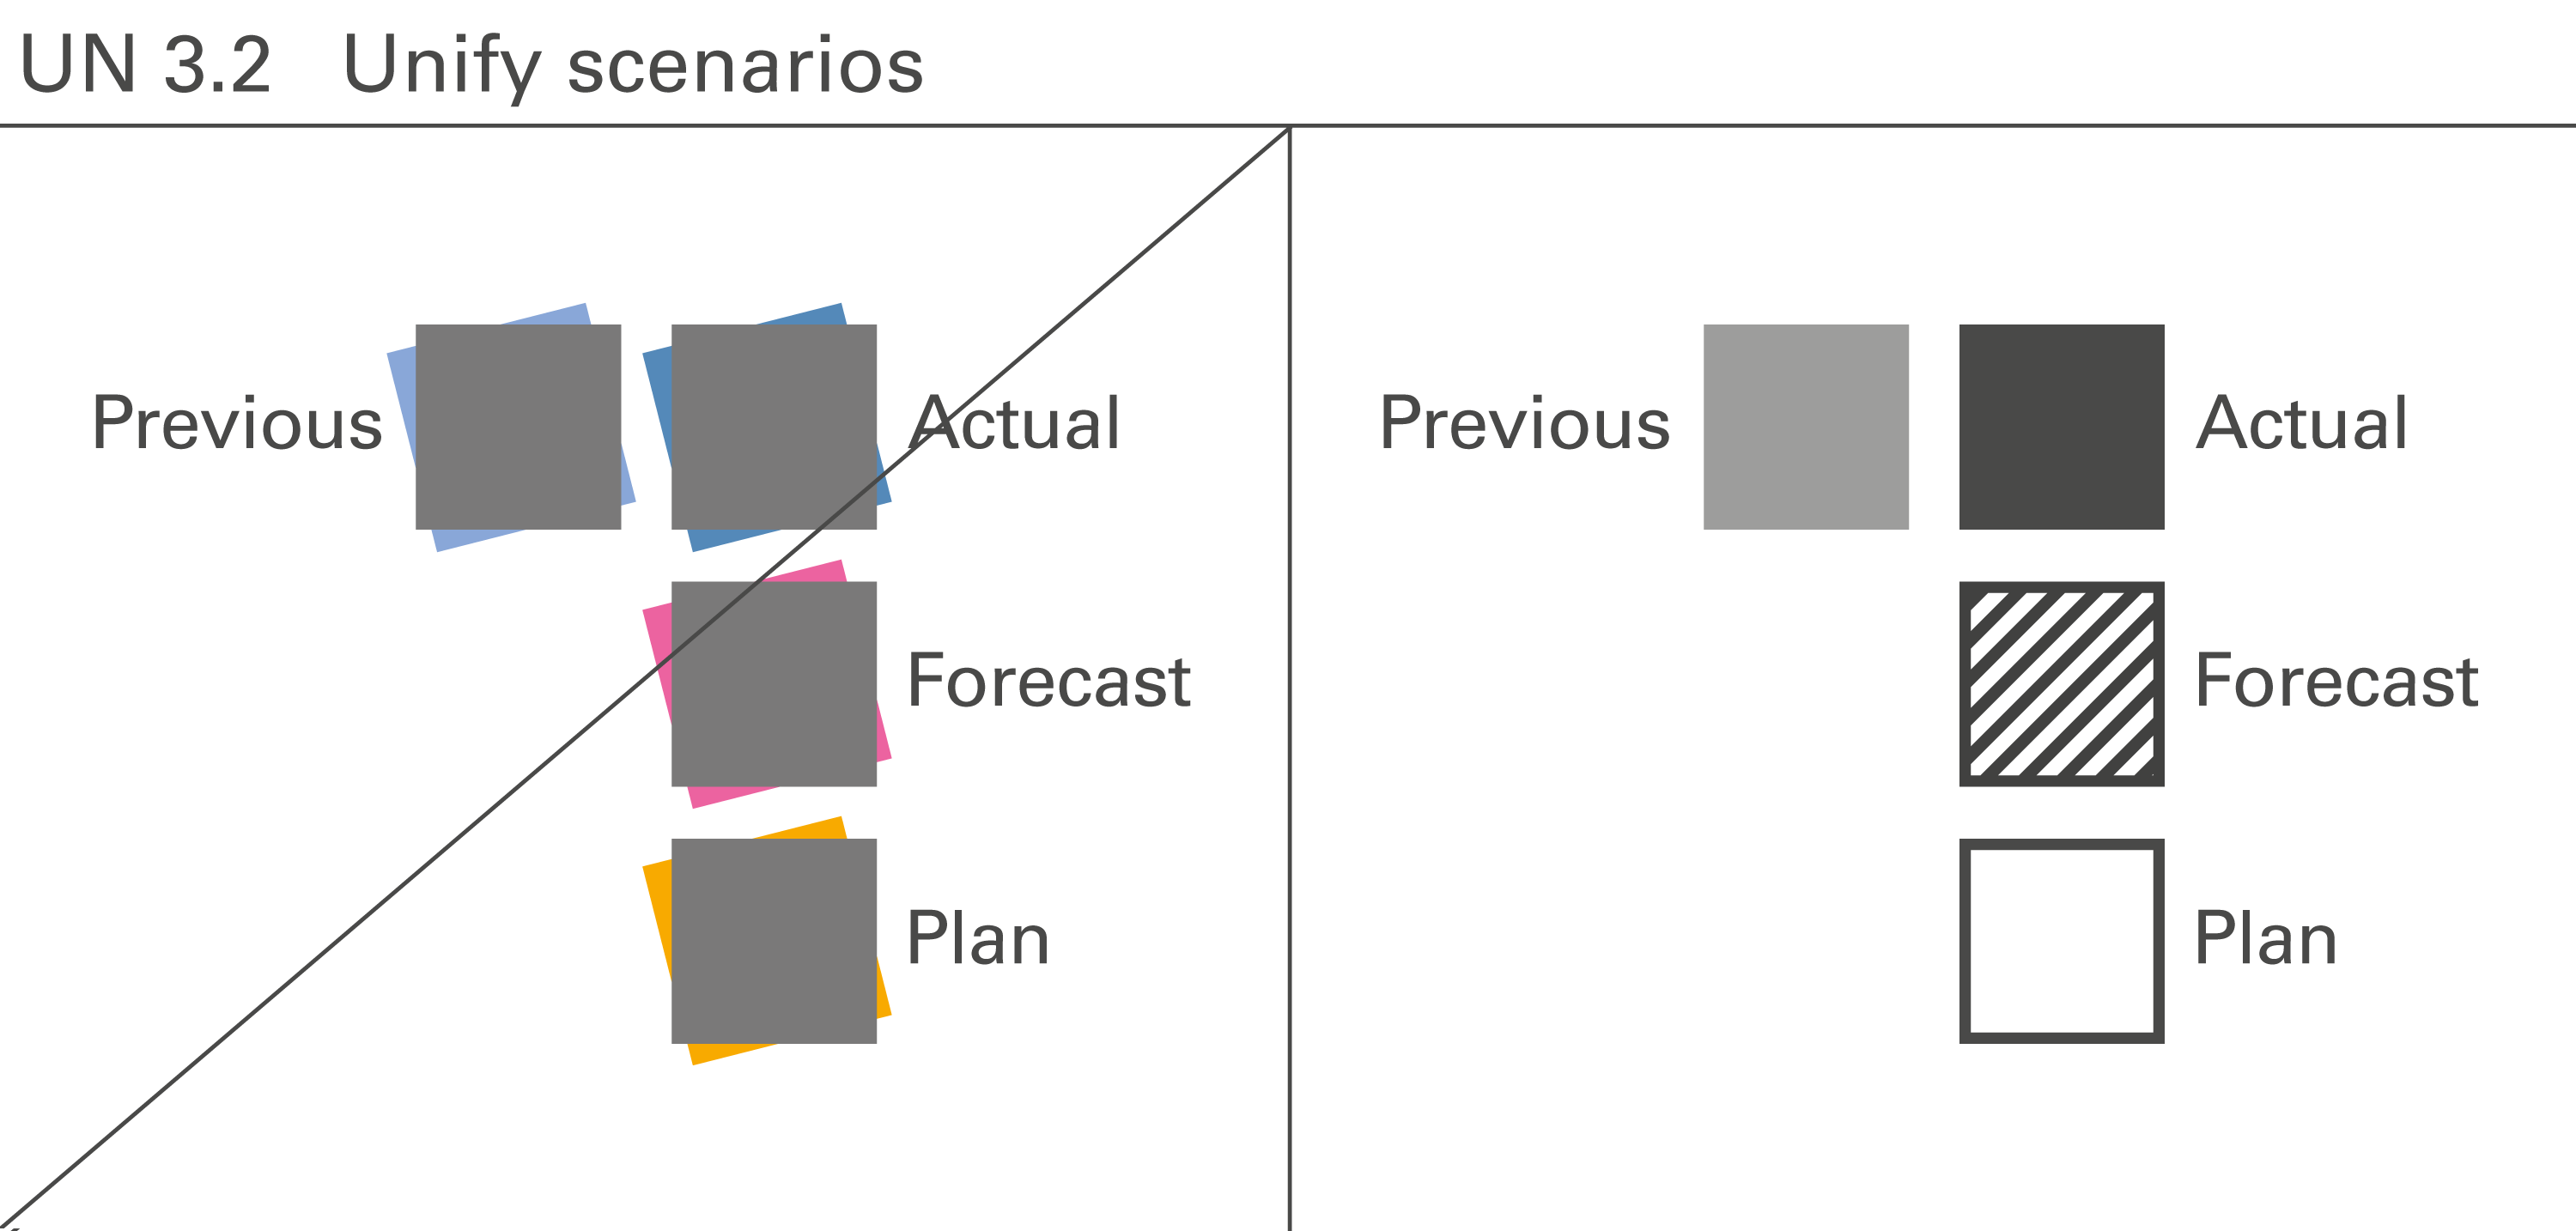
Always IBCS-correct
As you edit, UNIFORMCHART keeps the chart consistent — correct scaling, axis positions and notation — so the result stays standardized and clear.
- Correct scales and axes
- Consistent, standardized look
- No decorative clutter
Version & export
Every edit is saved as a new version, so you can review the history and restore any earlier state in one click. Export when you’re done.
- Full version history (with a free account)
- Restore any earlier version
- Export visualization, JSON or CSV
SUCCESS
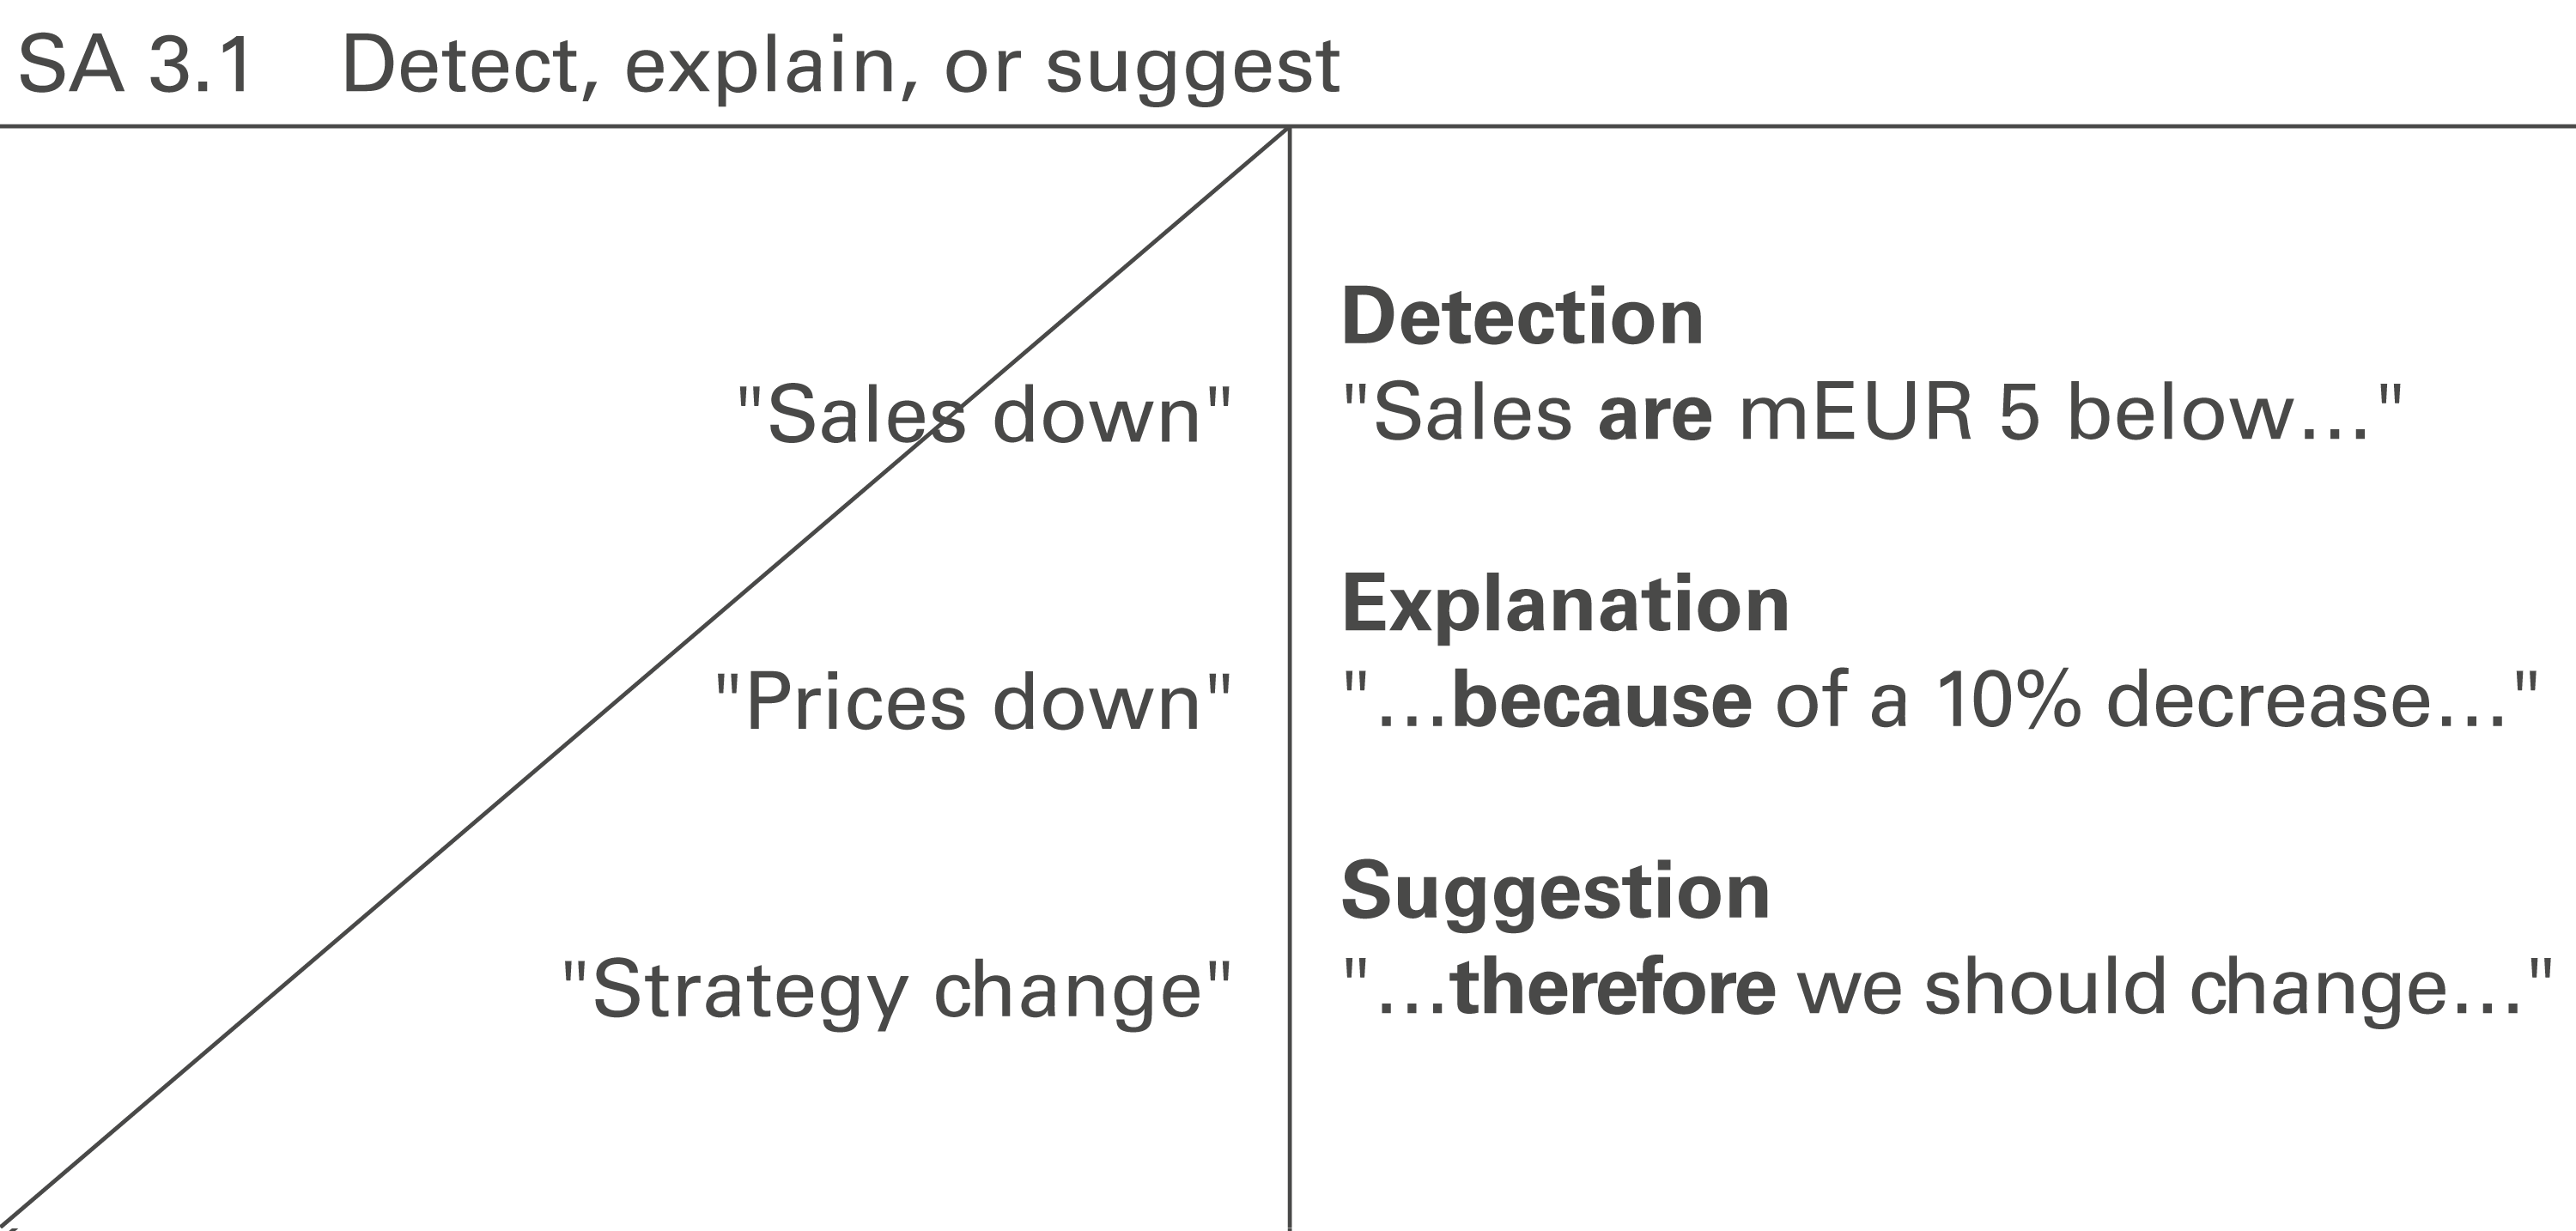
SAY: You have a clear message?
UNIFORMCHART will convey it.
Privacy & trust
Built to be trusted with your data
Your charts stay private
Saved charts are tied to your account and are never shared across users.
Private by default
We don’t sell your data and we don’t run ads. See exactly how we handle data in our privacy policy.
No lock-in
Export your data as JSON or CSV at any time — your charts and numbers are always yours to take.
Explore without signing up
Browse every template and learn how it works before you ever create an account.
Newsletter
Stay in the loop
Get product updates and new chart templates straight to your inbox. No spam.
Frequently Asked Questions